Efficient process data analysis and visualization
Valmet Self-service Analytics tools
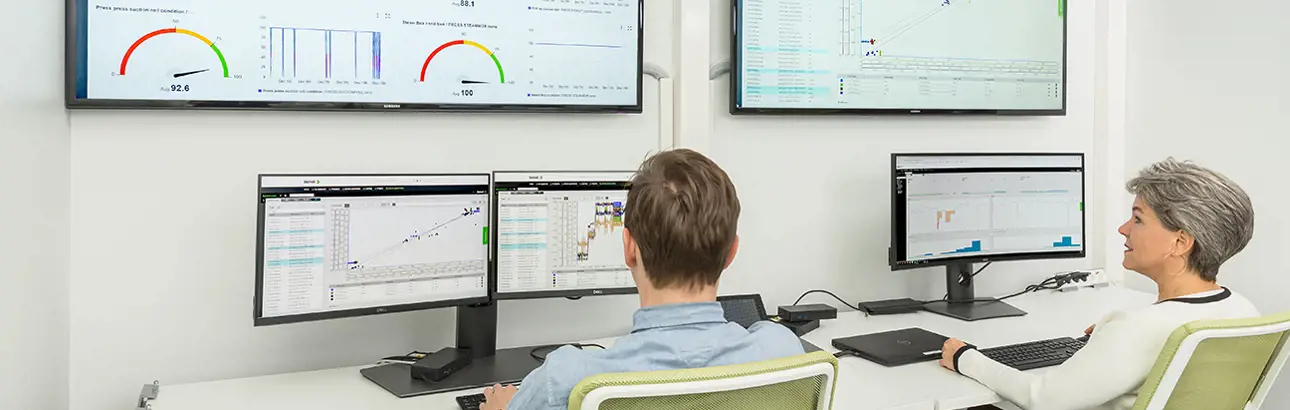
Utilize self-service analytics tools for efficient process study and data visualization. The Valmet Process Analysis Tool and Valmet Dashboard Creator enable easy and fast process data metrics follow-up, troubleshooting, and information sharing, and complement the Valmet Industrial Internet applications. The tool and applications are accessed through Valmet Customer Portal or directly 24/7 from your control room.
Powerful data visualizations for communication and analysis
Easy and fast data analysis for process data follow-up and troubleshooting
Shared view for efficient support and collaboration
Valmet Dashboard Creator
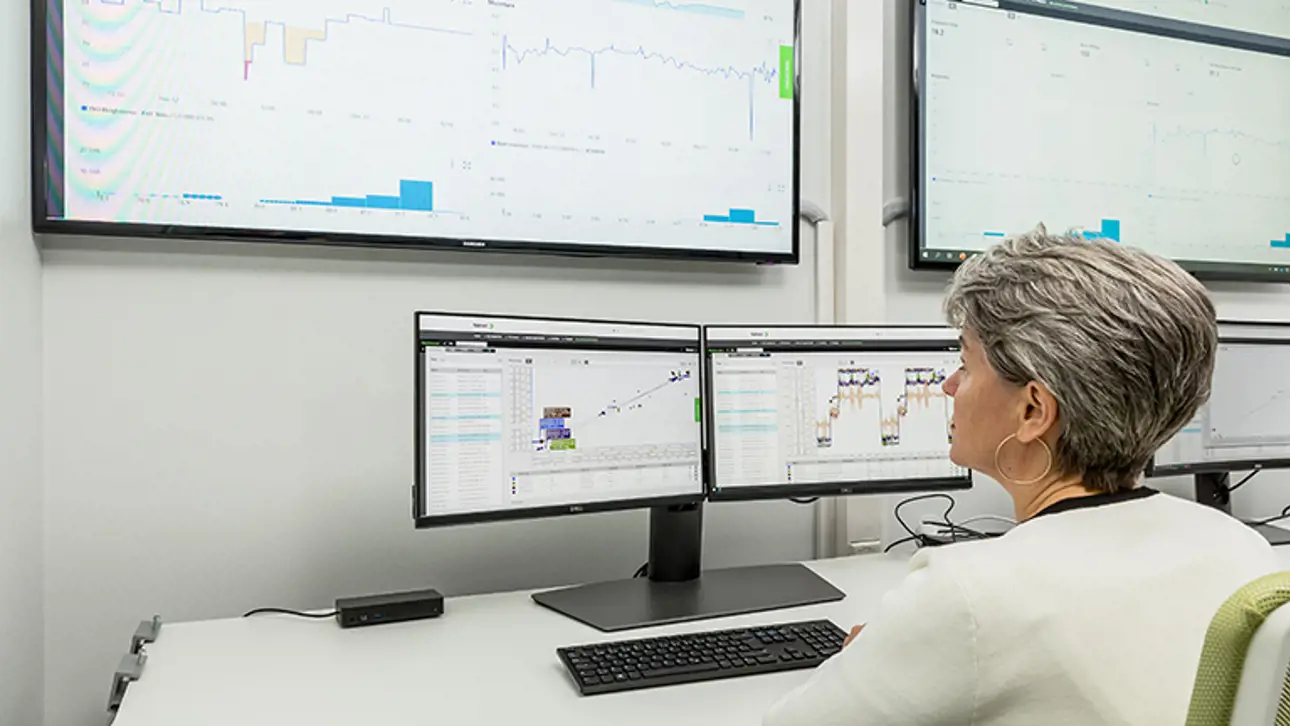
Valmet Dashboard Creator is a powerful self-service data visualization tool for communication and analysis. The tool allows you to easily create dashboards with graphical components for analysis and monitoring purposes. You can create dashboards to follow up your metrics or KPIs in the long term or create quick views to study process deviations or identify root causes.
The dashboard views can be easily saved and shared to collaborate within your organization, with Valmet Performance Centers, or with other parties who work with your data.
Valmet Process Analysis Tool
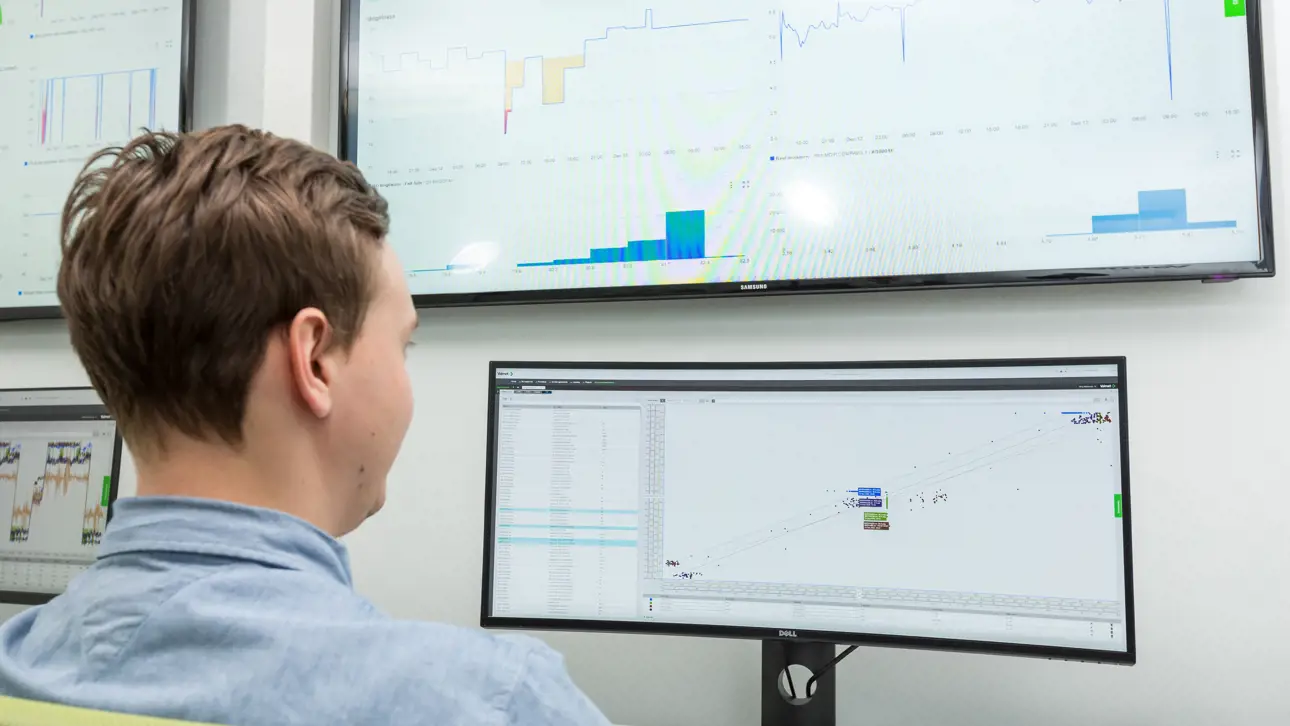
Valmet Process Analysis Tool is an easy-to-use trending, analysis and filtering solution for process studies. It allows you to follow, study or troubleshoot processes by comparing different production levels, searching high peaks from data, studying long-term systemic changes and variations, and filtering unnecessary data away. The tool is easy to use, fast and can be used with all process data tags.
Contact our experts
Want to discuss more? Please answer a few questions and our experts will contact you shortly.
Contact us


