1 Introduction to pipeline flow

1.1 General
This section presents several complicated flow problems in very simple form: firstly, flow behavior in common fluid systems; and secondly, pressure behavior in different piping components and flow induced dynamic torque.
1.1.1 Turbulent and laminar flow in pipes
The flow in conventional control valve installations is almost always turbulent. Laminar flow can occur with very viscous fluids, such as lube oil, and with very small flow velocities.
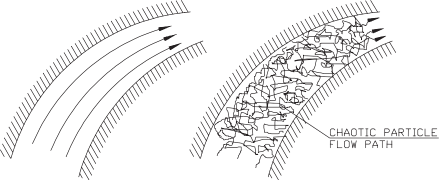
Laminar flow can be explained as a microscopic viscous interaction between several layers of fluid. In laminar flow, the fluid particles move in parallel paths or streamlines. A particle has only axial velocity along a streamline. Fluid layers slide relative to each other, and the streamline of an individual particle can be predicted.

If the velocity is increased above a certain limit, the laminar flow field is disturbed and fluid particles start to move in erratic paths. When this happens, the flow becomes turbulent. Transition from laminar to turbulent flow can be predicted by a single parameter, the Reynolds number (Re), as defined in equation (1).

Above a critical value of the Reynolds number, the flow goes through a transition to become turbulent. The critical value of the Reynolds number is around 3000 for flow in a straight pipe. When the flow is turbulent, part of the flow energy is used to create eddies which cause increasing pressure losses. Turbulent flow can be described as an irregular secondary motion of fluid particles. Secondary motion does not correspond to the principal direction of the flow. The flow path of a single flow particle is irregular.
1.1.2 Velocity distributions
Velocity distribution is affected by several factors including pipe surface roughness, turbulence level, and flow area changes. The shear stress of the fluid creates the velocity distribution in the flow. The flow velocity very close to the pipe wall is zero. This results in a significant change in velocity across the pipe cross section. As a result of different shear stresses in the flow, laminar and turbulent velocity distributions differ significantly from one another. In turbulent flow, the velocity gradient is greater near to the pipe wall than it is in laminar flow. In laminar flow, the center line velocity is higher than in the turbulent flow of equal mean velocity (figure 2).
With a smoothly shaped outlet from tank to pipe, the velocity profile is a function of distance. If not disturbed, the fully developed profile is constant. In a pipe elbow, the fully developed velocity profile is disturbed by inertia forces in the fluid (figure 3).
A more drastic change in the velocity profile can be caused by an orifice or a valve that creates a high velocity jet into a flow stream. On the downstream side of an orifice, there are strong vortices which cause flow pressure losses. High velocity jets are also accompanied by noise, especially in the case of compressible flow. The velocity profile after the valve is dependent on the valve type and design, and on valve travel. A fully open ball valve behaves as an extension to the pipe, thus not disturbing the velocity profile in the way e.g. butterfly and globe valves do.

Figure 2. Development of boundary layer.

1.1.3 Flow separation
After an abrupt increase in the flow area, static pressure at the pipe wall may increase in the direction of the flow. This creates a situation in which the forces in the fluid are imbalanced. If this imbalance continues over a sufficient distance, the inner layer of the flow may come to rest and even start to flow backwards. At the point where there is no forward flow, the velocity gradient near the wall becomes zero. This point is called the separation point because just beyond it, the flow is reversed and the free flow streamlines are diverted from the boundary (figure 4). Large energy losses are associated with separated flow.

Figure 4. Flow separation.
In throttling control, pressure differences are created through losses caused by separation. In pumps, piping, and piping bends, flow separation creates unnecessary pressure losses. Improperly designed or installed flange connections, pipe expanders, and bends require oversizing the pumps.

Figure 5. Flow separation in a butterfly valve and in a flow-to-close single-seat globe valve.
The idea of a control valve is to control the flow rate by controlling pressure losses across the valve. In practice, separation is the physical phenomenon which causes differential pressure across the valve. In future, stricter requirements for energy consumption change the design requirements for fluid transport pipelines. This means that permitted pressure losses in systems are going to decrease. Stricter limits on permitted pressure losses will require significant research efforts by engineering companies and valve manufacturers.
1.1.4 Pulsation in flow
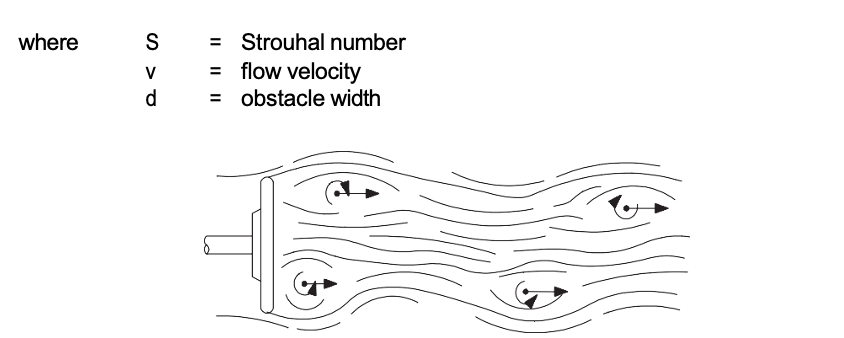
Separated flow can produce a large-scale vortex pattern downstream of the valve orifice. The periodic large-scale vortex frequency (f) after a valve plug can be calculated from equation (2).


Figure 6. Vortex pattern behind a poppet.
The Strouhal number is relatively constant for different Reynolds numbers, and its value depends on the geometry of the obstacle in the flow. Common values for the Strouhal number (S) are from 0.1 to 0.3.
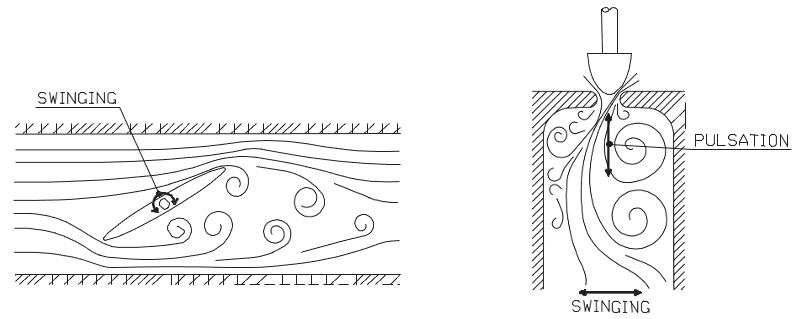
The large-scale vortex shedding, forming in certain valve types, is illustrated in figure 7. It should be noted that vortex separation can cause disturbances in valve capacity, particularly with certain large-diameter valves in liquid flows.

Figure 7. Periodic vortex pattern after a butterfly and a flow-to-close globe valve.
The disturbances caused by large-scale vortices due to flow separation can be eliminated or significantly reduced by increasing micro turbulence, or by shaping the flow path. Figure 8 shows examples of valve designs where these principles are used.

Figure 8. Examples of flow path modification used in rotary type control valves.
1.2 Throttling process for incompressible flow
Pipe flows involving valves for throttling control can be studied using simple one-dimensional flow dynamics theory. Incompressible flow through an orifice is taken as a basic example for flow velocity and static pressure behavior in a valve. Compressible flow can be studied similarly if gas expansion is taken into account.
Bernoulli's equation (4) gives the relation between mean velocity and static pressure. The continuity equation (3), and Bernoulli's equation (4) are all that is required to understand flow through a throttling device.

The continuity equation (3) demonstrates the balance between flow area and mean velocity. As the flow area decreases, the mean velocity increases and vice versa. The velocity reaches the highest value at the vena contracta point of an orifice. Vena contracta is the point where the actual flow area reaches its minimum value. Because of contraction caused by fluid dynamics, the area of vena contracta is usually smaller than the physical area of the orifice.
Bernoulli's equation (4) demonstrates the balance between dynamic, hydrostatic and static pressure. The hydrostatic pressure (r*g*H) can be assumed constant in the flow through a control valve. As the velocity increases towards the vena contracta point, the static pressure decreases. After the vena contracta, the fluid velocity decreases and static pressure increases. This phenomenon is called pressure recovery. Due to the pressure losses caused by flow separation and vortices, the level of static pressure is decreased across the orifice.

1.3 Defining pressure
In Bernoulli's equation (4), there are three different forms of pressure; static, hydrostatic, and dynamic pressure. Static pressure can be demonstrated with a small cylinder full of fluid and a piston on top of the cylinder, as shown in figure 10. If the piston is pressed downwards with force (F), pressure is exerted onto the cylinder. The value of the pressure equals to force (F) divided by piston area (A). The fluid in the cylinder exerts equal pressure on the walls of the cylinder.

Hydrostatic pressure is caused by gravity. In a tank of liquid, it depends on the fluid density and the height of the liquid column. Hydrostatic pressure equals the gravity multiplied by the fluid density multiplied by the height of the liquid column. Moreover, it is linearly dependent on depth. However, it is worth mentioning that it does not depend on the area or shape of the tank.

Figure 11. Hydrostatic pressure.
Dynamic pressure is related to relative speed of the pressure gauge and the fluid. It makes no difference whether the gauge or the fluid is moving. Dynamic pressure is proportional to the square of the fluid velocity. Static and hydrostatic pressures can be used to measure dynamic pressure and velocity. The measurement can be done within a relatively small range and takes into account only local velocity. To measure the pipe velocity profile or the mean velocity, many measurement points across the fluid cross section are required.

Figure 12. Dynamic pressure.
1.4 Pressure loss behavior of piping components
Pipe components including pumps, control valves, shut-off valves, elbows, joints, and the pipe itself have their own typical pressure loss versus flow rate behavior.
The pump pressure head is typically strongly dependent on the flow rate, so that the pressure head decreases when the flow rate increases. Pump manufacturers usually give this dependence in their manuals. In fluid transport systems, the pump is normally sized to operate at maximum efficiency in normal flow conditions. In minimum flow conditions, the pump pressure head is higher, and, in maximum flow conditions, the pressure head is lower than the optimum. This variation is seen in an increase in the pressure at control valve inlet as the flow rate decreases.
In a straight pipe, pressure losses are the result of pipe-wall roughness. Pressure loss is proportional to the square of the velocity, as indicated in equation (5), which means that it is also proportional to the flow rate squared if the pipe diameter is constant.

Piping loss increases rapidly as the flow rate increases. Almost all pipe components exhibit a strong dependence of pressure loss on the square of the velocity. For tank inlets and exits, elbows, shut-off valves, orifices etc. pressure loss characteristics can be expressed in the form of equation (6).


Figure 13. Pressure losses in a piping system.
In fluid transport systems, the differential pressure across a flow control valve is strongly dependent on the flow rate. Under normal flow conditions the control valve typically accounts roughly one third of the total pressure loss of the system. In the future, due to energy saving requirements, this will change so that control valves take smaller portion of the total pressure drop.
1.5 Valve dynamic torque
Valve dynamic torque, which tends to close or open the valve depending on the type of valve, is caused by asymmetric pressure distribution on the surface of the throttling element. Theoretical determination of the dynamic torque requires that the pressure distribution on the throttling element surface is known. Figure 14 shows a principle drawing of a pressure distribution that results in dynamic torque in a ball valve. In practice, dynamic torque (Md) is usually calculated from the experimentally defined equation (7).

Figure 14. Ball valve dynamic torque is formed by asymmetric pressure distribution on the inner ball surface.

The dimensionless torque coefficient (Cd) is determined experimentally using laboratory measurements. Figure 15 shows dimensionless torque coefficient (Cd) for a ball valve measured in a flow control laboratory. As can be seen from figure 15, the torque coefficient depends strongly on the relative travel (h) of the valve. Usually value of dynamic torque reaches a maximum when the valve is close to the fully open position. The dynamic torque is usually insignificant for small valves due to a small valve diameter DN. In butterfly and ball valves, dynamic torque differs from the torque caused by friction, because dynamic torque tends to close the valve.

Figure 15. Dynamic torque coefficient Cd for a ball valve.